Praha-Slivenec: housing and rent
Praha-Slivenec: how many people live here and how old they are, the houses and flats, what rent costs and how common crime is.
Residents
In 2025, 57 more people moved in than out (all of Prague +7.4 per 1,000 residents). 17. of 57 districts in Where people move →
Age structure and more
Houses and flats
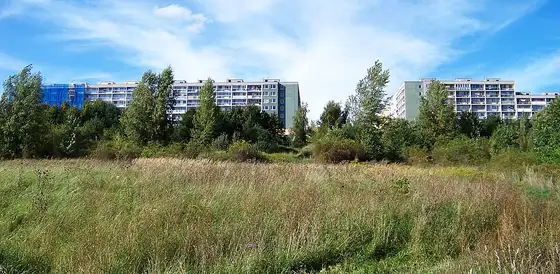
Blocks of flats 28: 0 % prefab panel (Prague 21 %), 25 % with a lift (Prague 47 %).
House age and owners
1 423 occupied flats in the 2021 census. Period of construction or the last major renovation of the house. Municipal flats in houses with an SVJ count under flat owners.
Rent
There were few rental offers in the neighbourhood, so the estimate is less precise.
All flat sizes
| Monthly | New build | |
|---|---|---|
| 1+kk, 1+1 · 35 m² |
13 900 Kč
396 Kč/m²
|
18 100 Kč
518 Kč/m²
|
| 2+kk, 2+1 · 53 m² |
22 400 Kč
422 Kč/m²
|
26 900 Kč
507 Kč/m²
|
| 3+kk, 3+1 · 71 m² |
29 000 Kč
408 Kč/m²
|
34 100 Kč
480 Kč/m²
|
| 4 rooms or more · 88 m² |
28 900 Kč
328 Kč/m²
|
34 300 Kč
390 Kč/m²
|
How we calculate it
The average of the district’s neighbourhoods weighted by their addresses in it. Rent without services and energy for an unfurnished flat older than 5 years in good condition, from rental offers. Monthly = price per m² × the usual size of rented flats in Prague.
Data up to 6/2026.
Rent or mortgage? Work it out on kalkuj.cz (in Czech) →
Current listings: flats for rent in Prague · for sale (Sreality, in Czech)
Crime
By type, and how we count
| Cases | Per 1,000 residents | |
|---|---|---|
| Violent crime | 1 | 0.2 · Prague 1.1 |
| Burglary of flats and houses | 2 | 0.5 · Prague 0.6 |
| Burglary overall | 6 | 1.5 · Prague 3.1 |
| Theft of and from vehicles | 5 | 1.2 · Prague 2.6 |
| Bicycle theft | 1 | 0.2 · Prague 0.4 |
| Pickpocketing | 0 | 0.0 · Prague 2.0 |
| Drug crime | 6 | 1.5 · Prague 0.7 |
| Offences against public order and coexistence | 20 | 5.0 · Prague 6.0 |
We count crimes and offences recorded by the police, without acts that didn’t happen or aren’t punishable. We leave out fraud and economic crime, which the police record where they are reported. The location is blurred to the centre of a small area. In the centre, near stations and big shopping centres visitors and commuters push the numbers up; in small districts a few cases make a big difference.
Frequently asked questions
What kind of houses are in Praha-Slivenec?
Praha-Slivenec has 28 blocks of flats and 1 224 family and other homes. Most of them are from 1991–2010: 40 % (city-wide 23 %). 0 % of the blocks of flats are prefab panel buildings (city-wide 21 %). 25 % of the blocks of flats have a lift (city-wide 47 %).
Is Praha-Slivenec safe?
The police record 4.5 cases of violence, theft and burglary per 1,000 residents a year. The median of the city’s districts is 6.8.
Are people moving to Praha-Slivenec?
Yes. In 2025, 57 more people moved to Praha-Slivenec than left: +14.1 per 1,000 residents (all of Prague +7.4).
← Back to the overview: Praha-Slivenec